Tag Archives: Gerrymandering

Looking back at election 2022

The 2022 mid-term election cycle brought some interesting results.  I mentioned a while back that I’d take a look at those results, with the perspective of hindsight and some data.  I’m here to deliver.  There’s a little math.  And some commentary.

In 2020 the nation conducted a nationwide census.  Based on those numbers all legislative and congressional district boundaries were redrawn.  [Well, not all.  A few states have only one Congressional seat]. These boundaries last 10 years, until the next census.  There’s usually a lot kvetching when states roll out their maps.  So that’s my main goal here: to objectively assess the district boundaries.  How well are the voters’ desires reflected?  Or, how badly are things gerrymandered?

A preliminary statement of the obvious. Gerrymandering does not affect presidential elections, or US Senate elections, nor any statewide election, such as Governor.

On a national level, it only affects the lower house of Congress:  the House of Representatives.  [It also affects states’ legislative districts, but that’s outside this essay’s purview.]

With that out of the way, let’s start at the very top level of the 2022 nationwide results.

Of just over 107 million votes cast for Congressional Representatives on November 6, 2022: 47.41% were for Democratic candidates; 51.56% went for Republicans; 0.54% for Libertarians; and 0.50% for sundry candidates of other parties.

When all the smoke had cleared and the dust settled, the final makeup was 213 Democrats and 222 Republicans.  Or 49.0% to Democrats, and 51.0% to Republicans. Overall, I assess this to be a very fair representation of the nation’s intent.  That’s overall.  There are some incongruent results on a more granular — state-by-state — level.

First, some caveats.

  • (1) Some states, most notably California and Washington, only permit two candidates on the November ballot. [Each state does have their own election rules].  In six California races there were two Democrats, and no Republicans on the ballot.
  • (2) Across all states there were 35 uncontested races in November.  In those, the unrepresented party obviously received zero votes (there are always a handful of 3rd party write-in votes).  Of these, 23 had only one Republican candidate, and 12 a Democrat.  [The Washington Post, and others, contend that this cost Democrats the national vote — as if that matters.  But there’s a reason no one opposed the single candidate: everyone knew the candidate was sacrificial and would garner few votes. Case dismissed].

The upshot of the caveats is that the November vote tallies can’t precisely reflect voters’ intentions by using simple ratios — at least with respect to parties they favored — as some voters were not able to cast a vote for a candidate of a party they preferred. Accepting that this puts some noise in the data … we forge ahead.  Nothing is perfect.

[So, for the top level, I assess that the allocation of seats by party tracked the electorate’s preference amazingly close.  Much closer than I’d expected.  See?  I’m wrong sometimes.]

Applying the same algorithm* as in my essay Mr. Gerry, I found the following the states to be the most egregious in mis-representing the voters’ intentions in the allocation of CD seats by party. {* see afterthoughts, below}.

________________________


State Bias Favoring
California 8 DEM
Illinois 5 DEM
Massachusetts 3 DEM
Connecticut 2 DEM
Florida 2 REP
Georgia 2 REP
Indiana 2 REP
Iowa 2 REP
Maryland 2 DEM
New Jersey 2 DEM
Ohio 2 REP
Oklahoma 2 REP
Tennessee 2 REP
Washington 2 DEM
Wisconsin 2 REP

________________________

On net, summing the entire table for all 50 states, the nationwide results of the election compared to my “fair” model show a +2 bias for Democrats, a -1 for Republicans and a -1 for Libertarians.

(Libertarians lost a possible seat in Texas in 2022.  Per 2020 presidential CA vote results, where minor party candidates received votes, and per my model, Greens and Libertarians would have received a seat.  However, the CA November election run-off model eliminated all 3rd parties).

The two states with the largest biases, CA and IL, were predictable.  Each has many Congressional Districts (53 and 17), and statewide they are overwhelmingly governed by one party.

Illinois, entire state CD map

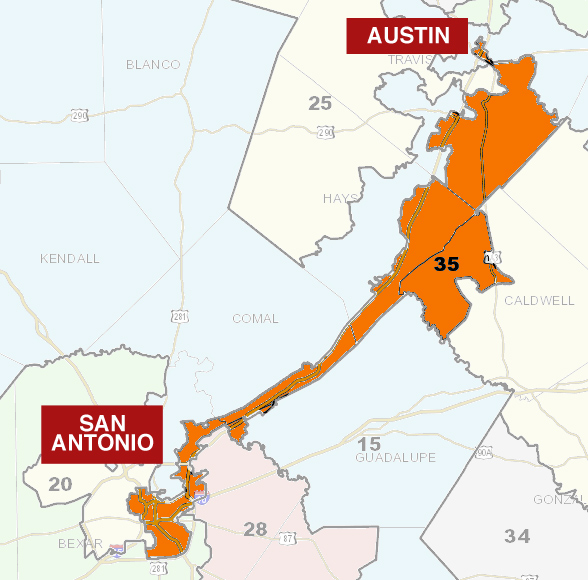
The absence of Texas on the list (38 CDs and mostly led by one party), and often pointed to as an example of extreme gerrymandering, is somewhat of a surprise. Observers have long bemoaned their districting map, including the esteemed Brennan Center on the current map.  They make some good points.  But Texas awarded 13 of its 38 seats (34.2%) to the minority party; statewide the Dem candidates garnered 34.7% of all votes cast.  A pretty good match. The bias in TX turned out Dem +0, Rep +1, Libertarian -1. Is there some gerrymandering in Texas?  Almost assuredly (see Brennan), but you wouldn’t notice by the bottom-line statewide results. In fact, the Texas results are so very close to the actual statewide tallies that one could argue that all the districts which appear gerrymandered are made that way to get a good balance in the result. [1]

Also, a bit unexpectedly, New York is not on the most-biased list (it came in at +1 Dem).  Republicans won 11 of New York’s 26 seats, or 42.3%.  Statewide Republican candidates received 41.5%.  A fair result. [2]      [yeah, yeah, George Santos, I know]

I suppose one could use these results as a sort of proxy to determine how much any one state might be gerrymandering.  That’s a tough call more than you’d think. Another proxy might be the bias as a percentage of any state’s total CDs.  For example, if a state has 6 CDs and statewide votes suggest a 3-3 split, but it ends up 5-1, then that’s a mis-allocation of 2 out of 6, or 33%.

Judged this way (for states with 3 or more CDs) the top mis-assigners are:

  • Iowa 50%;
  • at 40% are Connecticut and Oklahoma;
  • at 33% we have New Mexico and Massachusetts.
  • Illinois comes in at 29.4%.
  • And a few at 25%:  Arkansas, Kansas, Maryland, Nevada, Utah, Wisconsin.

As most in the list have only a few CDs, it’s difficult to determine a consistent gerrymandered bias. California, even with its large overall +8 Dem bias, is only 15% off, since it’s so large. In the largest states on this list, Illinois and Maryland, maps are mixed on suggesting any strong bias in district boundaries.

Illinois CD 13

I don’t want to dig too much into the states. There are 50 of them, and that would take quite a while. Maybe later.  But Illinois, the land of my birth, and the Cook County Political Machine, piqued my interest. How could the “Land of Lincoln” lose a seat and then get even more imbalanced?  [OK, OK, I know.  Richard “Boss” Daley has been dead a long time, and his machine has all but expired — but still: Cook County].  From the 100,000 foot level, the Illinois map (above) looks pretty even handed … with two exceptions (CD 13 and 17).   At a more granular level, some other stats stand out: there are 11 total CDs in and near Cook County (Chicago). All 11 went to one party, as did CDs 13 and 17.

I’ve discussed some other states before.  Maryland’s districts look much more reasonable since the recent redistricting.  Which goes to show that unbalanced results can result even when no gerrymandering is apparent from gazing at the CD boundaries.

Illinois CD 17

Some states have recently taken district boundary drawing out of the hands of (often very partisan) legislatures. Supposedly independent commissions drew the boundary lines. It looks like mixed results.  In a few (Colorado, Michigan) the results turned out exactly fair.  In others (Arizona, California, Washington and even New York’s first cut) missed the mark by non-negligible amounts. Which shows how difficult the task might be: both choosing fair “independent” teams and then actually drawing fair lines. [3]

A few years ago I wrote about racism in America.  Yes, there’s racism. Of course. Undeniable. It’s horrible.  It’s repugnant. Yet it’s not as bad as we are led to believe. Look where we’ve come in 60 years. Same with many things.  Bad things aren’t as bad as we often think; and good things aren’t as good (or lasting) as we like to think.  I submit it’s the same with gerrymandering — or at least with CD boundaries drawn so that voters’ interests aren’t fairly represented.

In 2022 the results look to much more fairly represent citizen’s intent than I thought when my research began a few months ago.  Maybe we just sort of got lucky with most bias effects more or less canceling out.  People will continue to kvetch, no matter what.  I tried.

Weirdly drawn boundaries aren’t in and of themselves evidence of such unfairness. And clean looking boundaries are no guarantee against it.

Look to the numbers first. Look fishy? Then look at CD shapes.  Double sniff test. Top level and at most state levels the results this time around were pretty fair.  Demographics change, and we are “stuck” with these boundaries until the 2032 elections.  Maybe I’ll be around then to reflect on how well the boundaries held up in representation fairness.

I am cautiously optimistic that, with states trending toward independent commissions to draw the lines and with state courts growing more willing to strike down blatantly unfair lines, we’ll continue to trend to even more fairness in the decades ahead. [4]

Well, we can hope.

Peace.

Joe Girard © 2023                                   — notes and afterthoughts below

Thank you for reading. As always, you can add yourself to the notification list for newly published material by clicking here . Or emailing joe@girardmeister.com

Notes on my election fairness model below, after all footnotes and maps.

[1] California and Illinois lost one CD each due to the re-apportionment after the 2020 census.  Texas gained 2 CDs. Sometimes people “vote with their feet.”

[2] the New York legislature submitted a CD map whose boundaries that were deemed a “brazen gamble” by the New York Times. In fact, they were ridiculous. These were judged to be unconstitutional by the state’s supreme court.  A court appointed ‘special master’ drew a set of much more competitive (and fair, based on results) districts.

[3] Both Washington and New York allow the state legislature to override the independent commission suggestions.  In New York, they did; and failed, as mentioned. In Washington, the commission failed to submit a map by the required deadline. It was drawn, just not submitted.  A bookkeeping fiasco.  In the end, the Supreme Court ruled that the commission’s map, even though submitted late, shall be accepted.  It’s impossible to call it a gerrymander, even though, based on statewide party vote tallies, the results would be different by 2 CDs.

[3a] The CD map of Massachusetts looks relatively benign.  Yet it yielded a

Massachusetts CD map not ugly, still results in 9-0 “split”

9-0 split, all for one party, despite any fairness models which would suggest 6-3, or at worst, 7-2. [see below]

[4] The US Supreme Court has declined to take cases of unfair CD boundaries.  This, they assert, is a problem for the states to sort out.

Maryland CD map; not nearly as contorted as before.  But yields the same bias as before. I ragged on Maryland before for the insane CD shapes.  They fixed the shapes, but not the bias.

[5] Afterthought: a reasonable way to address the representation fairness issue is to add more resolution to the districts by drastically increasing the number of Congressional Districts (and seats).  The number of representatives has remained essentially unchanged going back to our nation’s beginning (it’s grown only as states were added).
In 1900 each District had an average of 191,000 residents.  In 2020 that grew to 761,000.  It’s absolutely impossible to draw districts completely fairly when they each must have the same number of residents (in the same state) when there are so few CDs allocated.
I don’t know (or really care) if the chamber can hold more than 435 people.  I assume so, as joint sessions get an extra 100 in there.  Plus, many many representatives are not in the chamber for most sessions.


Notes on Joe’s CD election model: My model explained, by example.

Suppose a state has 10 CD seats to assign.  Party A gets 52.1%, Party B 43.1%, Party C 4.1% and the rest 0.7%.  We begin by multiplying the percentage for each party by the number of seats available.  Then we strip off fractions, using only whole integer numbers.
A) 52.1% x 10 = 5.21
B) 43.1% x 10 = 4.31
C) 4.1% x 10 = 0.41

Round 1: Party A gets 5 seats.  B gets 4.  That’s 9, there is one seat left over.

In our simple example 10% equals one full seat.

Subtract away from A and B what has already been awarded.

A is left with 2.1%, B with 3.1% and C is still at 4.1%. So, C gets the final seat.

Repeat until all seats are awarded.  So, in our example, if any further seats remain, C then loses its 4.1% (it’s been assigned a seat).  And the next seat, if available, would go to B. (3.1% > 2.1%).

It’s simple, elegant, easy to apply and – this year anyway – seems to have given a pretty good unbiased look at the results. (My assessment on how “unbiased” it is, well — that’s probably biased). Also, it’s not all that different than how the states are allotted CDs to begin with.

Post Election Thoughts, Part 2 – and Looking Forward

Since I wrote Post Election Thoughts 2020, Part 1 last fall, I thought I’d finally get around to a Part 2 — which is actually mostly a look forward, and not so much a look back.

First, a quick look back.  Presidentially, Trump lost.  Period.  Yes, of course there are many “couldas”, “shouldas”, “wouldas”, and “yeah-but-what-abouts”, but he lost.  A large percentage of Trump voters think it was rigged; and a large percentage of Hillary voters still think 2016 was rigged.  Nonetheless, it’s over. Like it or not, Joe Biden is your president, for now.

Is Joe Biden your president?

We’ve been hearing the “not my president” chant for decades now.  First under Clinton, then growing ever louder with Bush 43.

I will throw a bone (or perhaps chew toy) to that crowd of howlers and doubters and concede that it looks like there were more than a few voting anomalies, such as sketchy absentee ballots and ballot-curing oddities, in populous counties of states that were extraordinarily closely decided: e.g. Maricopa in AZ and Fulton in GA.[1]  Regardless, it’s also evident that none of those were enough to swing a state, let alone the entire election.  Gonna take that bone away: this happens every election.  Every – single – pelection.  There are always anomalies and sideways glances.  Nothing is perfect, even democracy. Or perhaps, “especially” in a democracy.

This is one reason that I remain (slightly) in favor of the Electoral College (EC) over the National Popular Vote movement: it may be possible to corruptly swing a single state or two. But even if an entire state was so messed up (or amoral) that 100% of the vote went for one candidate (or, even 110%), it does not sway the EC outcome much at all.  It’s simply more difficult to fraudulently sway a large number of states without detection.

Built into this is a second reason: the EC usually (not always) gives a pretty clear indication of just who won.  For example, in the last two (very tight) elections the winner won by identical 306-232 [2] votes.  Fairly convincing majorities (yet Trump labeled his 2016 win a “landslide” despite losing the popular vote 46-48%).

Speaking of “minority” presidents, the EC gave Abraham Lincoln a clear majority over three other candidates receiving EC votes in 1860, despite garnering less than 40% of the popular vote.

[1] given the closeness in Georgia (a current official difference of only about 11,000 votes out of 5 million cast for all of its 16 Electoral votes) my pre-election assessment that a presidential vote counts more in Georgia than any other states stands substantiated.

[2] note that so-called “faithless electors” changed this 306-232 outcome slightly in 2016.  Per a recent 2020 Supreme Court case (Chiafalo v. Washingtonwhich was combined with Colorado Department of State v. Bacawe will likely see an end to such faithless electors soon — a situation I do not agree with)

One last thought looking back at 2020 and the presidential race.  I assert that without two things Trump wins, hands down.

  • Number one: obviously, the novel corona virus. The pandemic, our collective responses to it, and the consequences thereof completely pushed what was an almost certain Trump win into the gray area that columnists and the news media love.  Pre-pandemic the economy was roaring with record low unemployment as well as record high employment (and salaries) for minorities (especially blacks) and women.  Oh my, how that flipped.
  • Number two: Trump is an ass who broadcasts whatever undisciplined thought floats into his maze-of-a-brain without any filter whatsoever. Very unpresidential. Of course, he said stuff like “one day the virus will just go away.”  He didn’t do himself any favors. I score it an unconvincing 2-1 loss with an own goal.

Ok, enough looking back.  Now forward.


The US decennial census results are finally in, some four months late.  (Late, owing to the pandemic, and a few court battles about whether the census can legally count non-citizens as non-citizens).

The results are only a tad surprising, and there are some golden nuggets and poison pills for both Dems and Reps, although long term it looks better to me for Dems.

First, the population only grew about 7.4% over the entire decade; that’s the slowest growth since the Depression and Dust Bowl-cursed 1930s.  Still, 47 of the 50 states (48, including DC) recorded population growth; the losers were West Virginia (-3.2%), Mississippi (-0.2%) and Illinois (-0.1%).

Looking forward: Reallocation of Congressional District Seats, and thus Electoral Votes have been determined.  The “winners” are Texas (+2), and the following at +1: Colorado, Florida, Montana, Oregon, and North Carolina.  The “losers”, all at -1, are: California, Illinois, Michigan, New York, Ohio, Pennsylvania, and West Virginia.  [this is the first time California, the nation’s most populous state, has ever lost a congressional district; for New York it’s just the second: they lost two seats in 2010].

Nominally this looks like a slight win for Republicans, as more generally Rep voting states get additional congressional seats and Electoral Votes, drawing away from solid Dem states like CA, NY and IL.

If one thinks the presidential contests of the past were dirty or tainted – think of the angst following both ’16 and ’20 –  then one hasn’t ever paid attention to re-drawing of Congressional Districts and state legislative districts, which has been, and is going on, under our very collective noses. It’s a terrific example of “polite fiction.”  [“Terrific” is etymologically related to “terrible”, in this case for good reason]. The “Fiction” being that this is all fair, balanced and representative.  This has been historically, and still is, the unseen dirtiest of dirty businesses – classic smoke-filled room stuff that we don’t get to see much of; something that is supposedly based on balanced and fair representation. In reality it’s highly partisan in most states, and the process will take its toll on anyone’s faith in the notion that the drawing of district boundaries is fair and independent.

For example, Illinois, which is hard left leaning, at least state-wide (voting 55% and 57% for the Dem presidential candidate in ’16 and ’20 and only having Dem US senators since 2010) currently has 18 congressional seats: disproportionately 13 Democrat and 5 Republican.  The new state CD map managed to squeeze an incumbent Republican out of his seat, Adam Kinzinger; this, despite the state losing a seat and having a solid majority of Dems in the current tally, so it will be even more disproportionate.  Not sure how this plays out long term, since Kinzinger has been a critic of Trump, especially his bitching about the election.

On the other hand, one can be sure that the heavily Republican-leaning Texas legislature will ensure that the two “new” districts will lean Republican as well. More on Texas in the footnotes.

This all has to be done quite quickly, as the campaign season for the 2022 mid-terms is already underway.  The 4-month census delay has not helped map drawers meet deadlines. [By the way: since 1935 the sitting president’s party has lost seats in congress in all but two mid-term elections.  Because the Dems currently hold a very narrow 220-212 edge – with 3 vacancies – we can count on the drawing of CD boundaries and campaigning to be very contentious.]

And, probably about as important, each state must now re-draw their state’s legislative and senate districts (except Nebraska, which is unicameral, and only draws one set of district maps). Again, these must be drawn very soon.  Haste makes waste, so be careful.

Back to census-based demographic trends, most of which look to be favorable to Democrats.

  • America continues its over-one-century migration away from its wide swaths of rural regions, and toward the urban, suburban and exurban centers.  Urbanites, and those close to urban areas, tend to vote Democrat; Rural dwellers tend to vote Republican. Covid might have changed this, as it hit right in the middle of the census; so it will take a decade to see what the impacts are.
  • Racially, there are actually fewer total Whites than in 2010; Whites tend to be more likely to vote R than D. [Trump got 57% to Biden’s 42% of White votes in 2020].

One demographic that I noted could slightly favor Republicans.  America is aging. The Average age in the US is up 1 year, from 37.2 to 38.2.  Mostly this is due to longer lives among Baby Boomers and older (those born before 1964). Older people have a slight tendency to vote Republican, and they definitely get higher voter turnout. It’s also partly due to a falling birthrate.

Regarding voting patterns. People tend to vote how their friends, neighborhood, and fellow community members vote. This has become kind of a closed-loop feedback system, as people now tend to socialize and associate mostly (or only) with those who think like them politically. I don’t think this happened nearly as much before, say 2000.  We are very polarized now.

There’s also a high correlation between population density and political voting patterns. Below 800 per square mile people tend to vote Republican; and below 100 overwhelmingly so.  It starts to change between 800 and 2,000 per sq mile.  From lower population densities, but still urbanite densities like Denver and Saint Louis (both just under 5,000/sq. mi.), to larger BostonSan Francisco and New York (14,000, 19,000 and nearly 30,000 sq.mi.) one sees profound diluvial pro-Democratic voting patterns.

For Republican patterns and densities, one would need to look at county population numbers; I can’t think of a single urban center that leans Republican.  I suspect that two major factors here are: the higher the density the more the propensity to perceive benefit from bigger and more active government (efforts to de-fund police notwithstanding), and urban areas tend to have higher populations of people of color, who generally vote Democratic.

Re-districting and the associated “food fights” are almost inevitable. Highly political gerrymandering is not a necessary outcome every decade.  Although states like Texas and Maryland (and several others) seem doomed, for now, to their grossly distorted Congressional District maps, several states have recently taken map-drawing out of the hands of their politically-motivated legislatures (and even state courts) and put them in the hands of supposedly non-partisan commissions. [3]

Maryland’s CD map, 2012-2020. CD 2, 3, 4,and 7 are so contorted it hurts one’s head

My home state of Colorado is one of these; we voted for two such special commissions back in 2018: one for US congressional districts, and one for state legislative districts.  Kind of a big deal, especially since Colorado has an additional congressional seat starting in 2022 – now up to eight.

Other states that are now drawing maps via “independent” commissions are: Alaska, Arizona, California, Idaho, Michigan, Montana, New York and Washington. I can’t help but be skeptical of the “non-partisan” rating each commission would get, but I’m also optimistic that increased fairness and representation will result. (AK and MT have only one CD, but this applies to their state legislatures as well).  I’ve heard some squawking about preliminary maps from all sides already.

A few elections to look forward to besides the November 2024 Presidential and General Elections – when we will no doubt be told, yet again, that “this is a matter of life and death”, and “this is the most important election in our lifetime.”  (Insert breathless, feverish inflection as you wish).

I touched on the mid-term races in 2022, but special congressional elections will be held to fill vacancies as well in November, 2021.  With a Senate split at 50-50 there are several 2022 Senate elections to watch closely, wherein Reps must defend 20 seats, the Dems 14.  The likely close races to watch here look to be: Georgia (again), Arizona, Missouri, Nevada, New Hampshire, Pennsylvania and Wisconsin.  Of these likely close races, Reps are defending 3 seats, Dems 4. Be prepared for an extra onslaught of advertising and “persuasion” if you live in those states.

And coming sooner, this year in September: (1) the nation will watch the recall election of Gov Newsome in California on the 14th, and (2) Europe – indeed, the world – will pay attention to see how Germany reshapes itself in the post-Merkel era, as they hold federal elections on the September 26th.

Enjoy the rest of your summer!

Joe Girard © 2021

Thanks for reading. As always, you can add yourself to the notification list for newly published material by clicking here. Or emailing joe@girardmeister.com

[3] Fewer Whites than in 2010.  This might party be attributed to several factors.  (1) more mixed-race couples and people-in-general who identify as non-racial, (2) mixed race people who identify as a person of color (e.g. Barak Obama who is exactly ½ White and ½ Black definitely identifies as black; people like Tiger Woods, who at ¼ Black would identify as Black), and (3) a reluctance — or even rebellion — by Whites against identifying people by race; e.g. some identify as Native American.  Why? They were born here, as were their parents and grandparents. They identify as Native.  Hmmmm.]

Original Gerrymander cartoon

[4] Gerrymandering is named for early Massachusetts politician, Governor, and 5th VP of the nation, Elbridge Gerry, who helped draw and then approved a political map of his state that was so distorted (in order to keep his party in power) that a district looked like a salamander.  Thus the word is a sort of portmanteau of his name and the amphibian.  Many states have outdone him today.  As Gerry was one of the nation’s founding fathers, it’s sometimes interesting to think that many modern jurists should divine to understand the thinking of founding fathers, and then seek, anachronistically, to incorporate such into modern judicial decisions).

Not all of Texas is severely gerrymandered, as much of it is rural and undividably safely Republican.  It is too large of a state to easily show all of the congressional districts at once in much detail, but the generally progressive counties containing cities like Austin and San Antonio have been chopped up and districted so that Dem Congressional representation is diminished.  Politics, it is said, is a full contact sport.

Shown is current Texas CD 21, in which fragments of San Antonio and Austin are lumped in with an enormous swath of rural-dom. Alongside is Texas CD35, which is more of a salamander and ridiculous.